Understanding Auto Insurance Rate Increases: The Impact of Vehicle Theft Trends
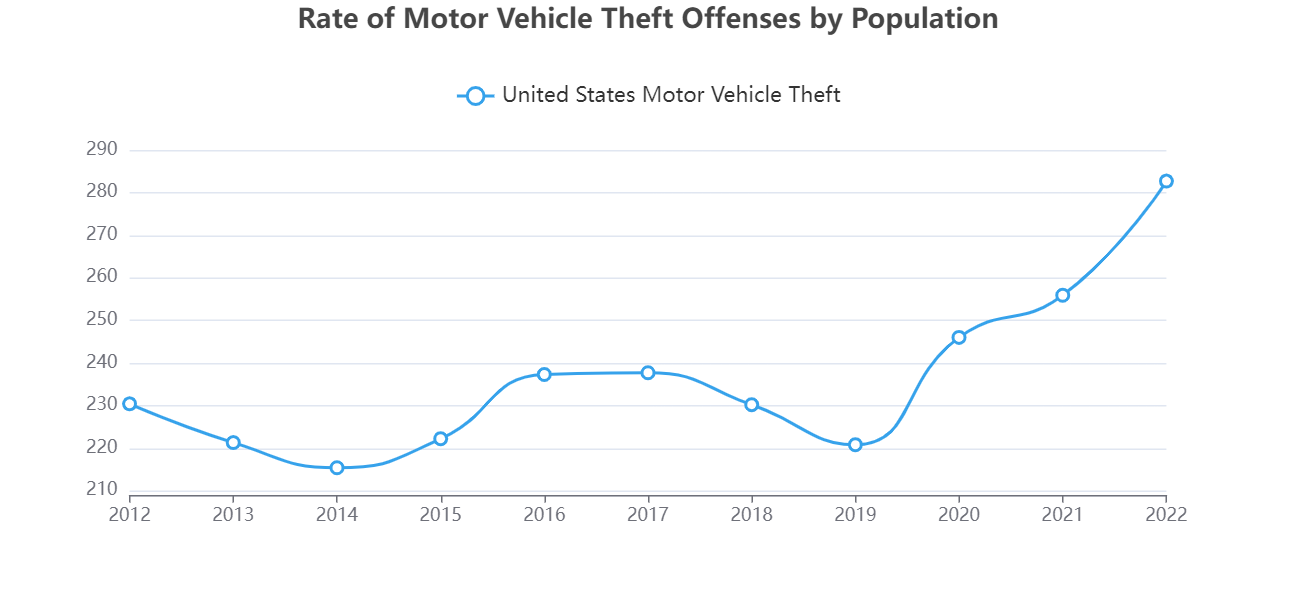
The first chart here is for the United States as a whole. As can be seen here, the motor vehicle theft rate remained relatively stable from 2012 (230.4 per 100,000) through 2019 (220.8) before seeing an increase year over year through 2022 (282.7). This is about a 28% increase over the last three years of available data. This change can be seen more dramatically by looking at numbers by the individual states. Unfortunately for our clients in Washington and Oregon, our home states happen to be among the worst in the country for motor vehicle theft, but we will start in the worst state, which is Colorado.

The grey line in this chart is for the nationwide rate, same as the first chart. The blue line is tracking the rate for the state of Colorado. Back in 2012, Colorado’s rate of vehicle theft was almost the same as national rate at 233.2 per 100,000. There was then a steady increase through 2019 before we see the spike again for the years 2020 through 2022 ending at a rate of 785.7 per 100,000 or almost 3 times the national rate of motor vehicle theft.
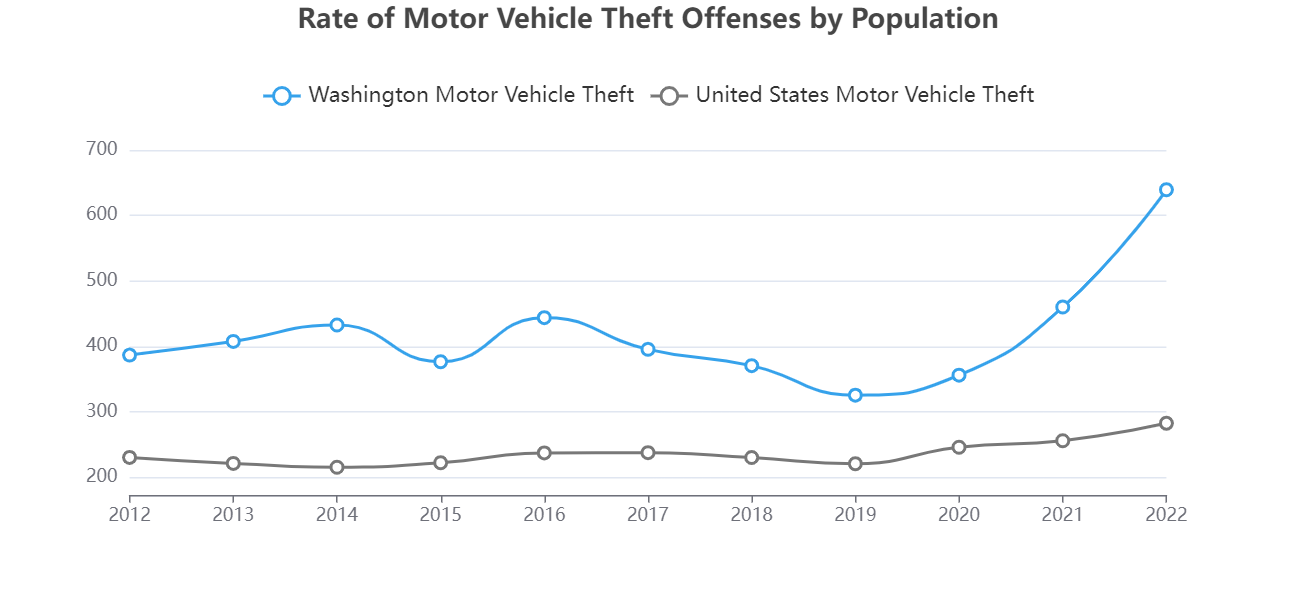
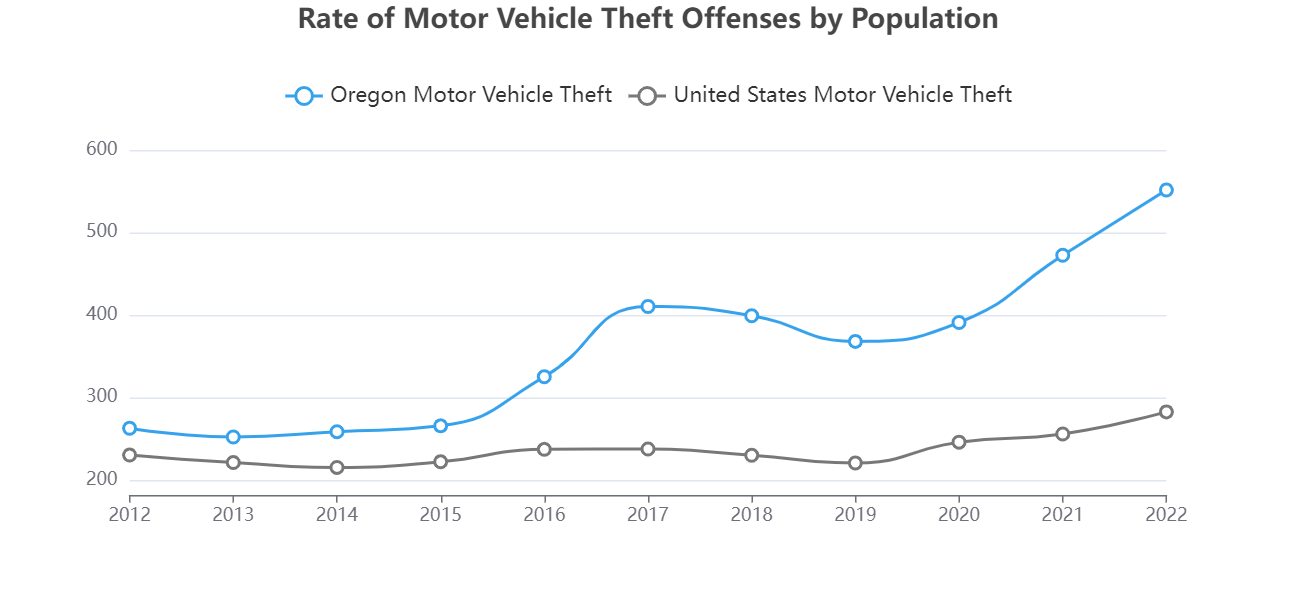
The next state represented on the chart above is the second worse state in the country for motor vehicle theft, Washington. Again, the national rate is represented by the grey line while the state of Washington is represented in blue. Washington is different from Colorado in that it began 2012 with a rate already above the national rate, and Washington actually experienced a decrease from 2012 (386.7 per 100,000) through 2019 (325.5 per 100,000). However, we see the same spike in the years 2020 through 2022 where Washington ended with a rate of 639.3 per 100,000, greater than twice the national rate of 282.7. The tale is not much better for Oregon.
New Paragraph